
Rising Rates, Resilient Growth
Markets weakened as bond yields surged, but earnings outlook remains intact
Market Recap
September was marked by broad weakness across financial markets as investors continued to contend with a sell-off in bonds, lingering uncertainty surrounding inflation, and the ongoing war in Iran. As expected, the Federal Reserve moved forward with a 25 basis points rate hike and signaled that additional hikes may be necessary to contend with a recent resurgence of inflationary pressure. Bond yields surged throughout the month, with the benchmark 10-year Treasury yield rising by over 50bps and ending the month just below 5.30%, a level not seen since 2007. With financing costs moving starkly higher and geopolitical uncertainty remaining elevated, most major equity and fixed income benchmarks shed value during September. Commodities were the only major asset class to post a positive monthly return, buoyed by elevated oil prices.
U.S. equities were mixed but generally softer. The S&P 500 declined 0.3%, though the index remained up 12.7% year-to-date. Smaller companies – which tend to carry more leverage and are thus more impacted by rising interest rates – experienced larger losses, with the Russell 2000 falling 5.3% during the month. Even after the decline, small caps retained their advantage over large caps, ending the month with a 13.7% year-to-date gain.
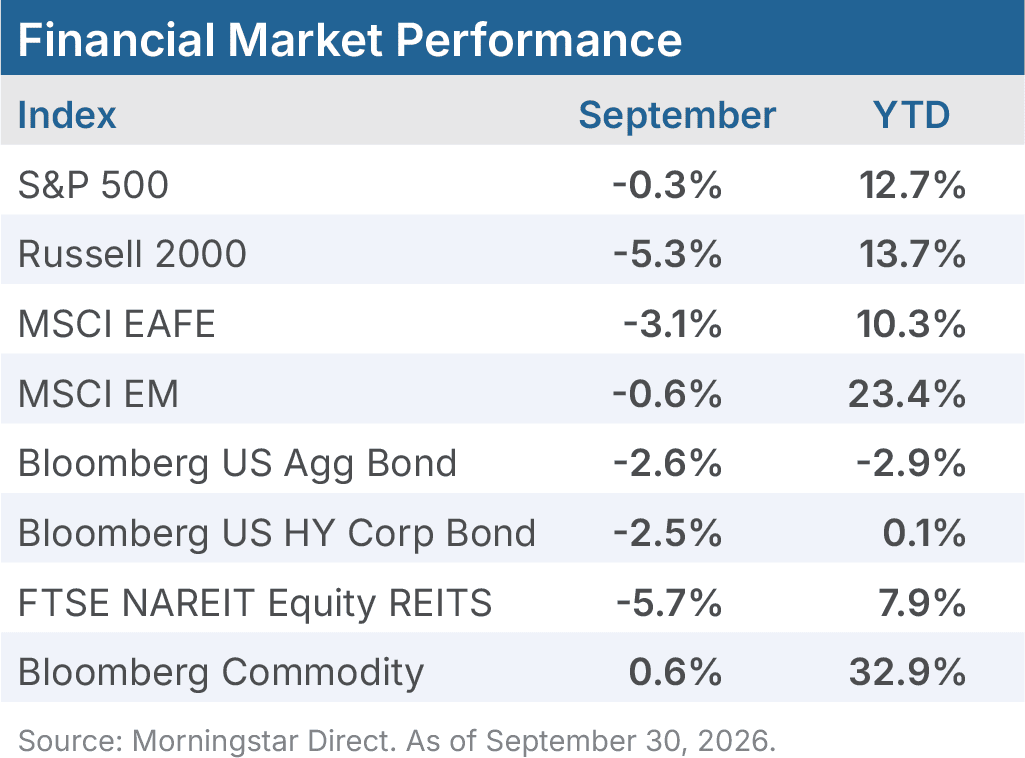
International markets also moved lower. The MSCI EAFE Index returned -3.1% in September, reducing its year-to-date advance to 10.3%. Emerging markets proved more resilient, with the MSCI Emerging Markets Index declining by a more modest 0.6%. Emerging Markets remain the strongest equity performer for the year, up 23.4% through September.
Fixed income came under pressure during the month as markets firmly priced in a Fed hiking cycle and began demanding a meaningfully larger term premium. The Bloomberg U.S. Aggregate Bond Index fell 2.6% and has now returned -2.9% for the year. Credit did not fare much better, as high yield bonds declined 2.5%, though the Bloomberg U.S. Corporate High Yield Index held onto a slight 0.1% year-to-date.
Real assets again told two different stories. Tightening financial conditions were a drag on listed real estate performance, as the FTSE NAREIT All Equity REITs Index fell 5.7%, though it remained up 7.9% year-to-date. Commodities were the month’s lone advancer, as the Bloomberg Commodity Index gained 0.6% and extended its year-to-date return to 32.9%.
What’s Next for the AI Capex Cycle?
The AI capex boom has been a key driver of equity market performance over the past 24 months and continues to show no sign of abating. According to Oxford Economics, cumulative AI-related investment has exceeded 2% of US GDP over the past three years1, while the IMF estimates that AI-related technology investment added 0.5 percentage points to U.S. GDP growth in 20252. The impact on corporate earnings has been even more profound, with the S&P 500 expected to produce a third consecutive quarter of YoY earnings growth in excess of 25%. The tremendous momentum in earnings has been a key pillar of support for equity markets despite a backdrop of tightening financial conditions and elevated geopolitical uncertainty. It has also allowed equity markets to post double digit returns in 2026 without a commensurate expansion in valuation multiples.
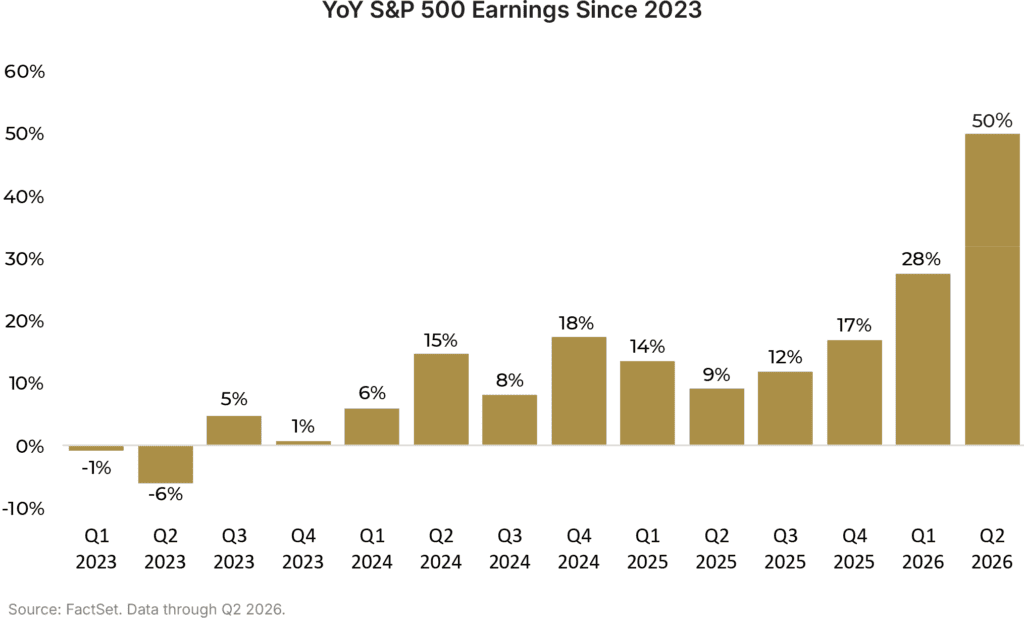
The scale of the AI capex boom is significant in a historical context, and the incredible explosion in earnings growth that has accompanied it introduces an important distinction from the past. But the conversation is now maturing, and the question is shifting from how much companies will spend on AI infrastructure to whether that spending will earn attractive returns and how it will be financed. To date, AI spending has primarily been funded from the operating cash flows of some of the most durable and successful businesses in economic history. While that remains true, there is increasing evidence that the massive capital expenditures being pushed into AI infrastructure are having a profound impact on the financial flexibility and capital structure of many businesses in the ecosystem.
Consensus expectations for free cash flow across the major hyperscalers have now collapsed into negative territory due to AI-related capital expenditures. With available free cash flow depleted, companies are increasingly turning to debt markets as a source of capital. Keen observers of credit markets will note that credit spreads for the largest cloud and AI companies have widened relative to other high-quality corporate borrowers. Financing costs remain manageable for investment grade issuers, but with the Fed now entering a hiking cycle, markets are becoming more discerning about rising leverage, negative free cash flow and an uncertain payback on rapidly depreciating assets.
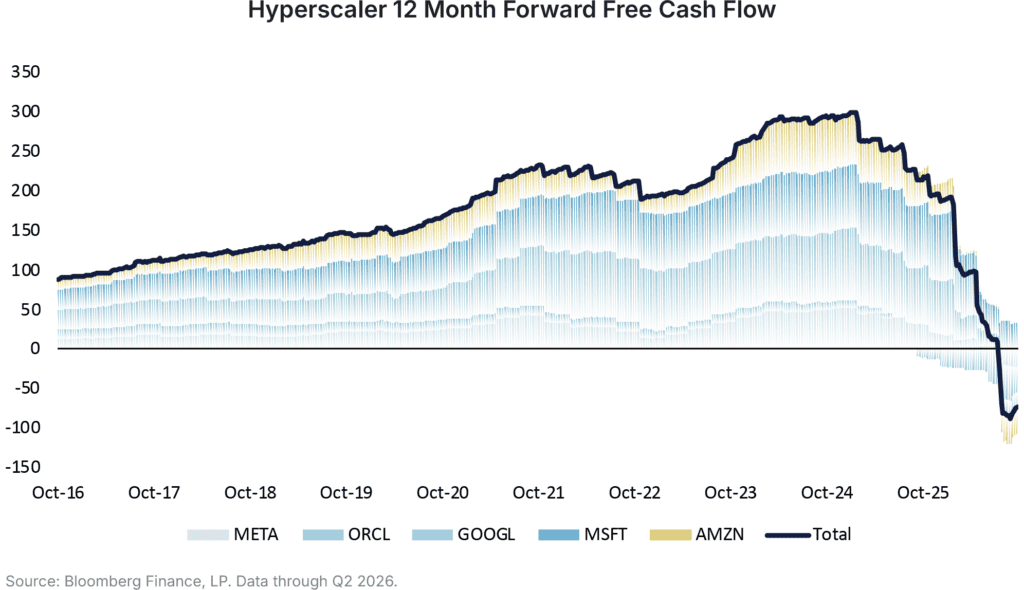
None of this suggests an imminent slowdown, but it reinforces the need for investors to think critically about risks and maintain proper balance in portfolios. Debt can bridge the gap between construction and future revenue, but it can also make that gap less forgiving. Interest and principal payments remain due even if customer adoption takes longer than expected or the anticipated productivity gains do not materialize.
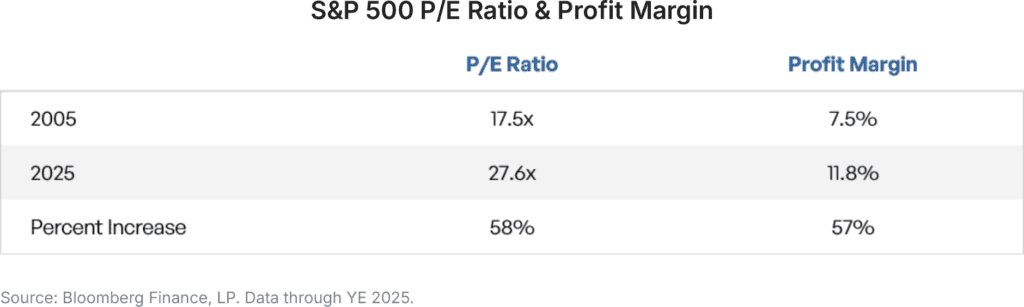
We have pointed out in recent publications that the increased breadth of markets in 2026 is a positive sign of market resilience, and it is difficult to argue that prices have obviously run away from fundamentals. Between 2005 and 2025, the trailing 12-month P/E ratio of the S&P 500 expended 58% from 17.5x to 27.6x. On the surface, this would suggest markets became exorbitantly expensive over that time frame. But considering profit margins increased by roughly the same amount, a reasonable argument could be made that vastly improved fundamentals and earnings power justify a higher price. Much of that improvement can be attributed to the proliferation of technology and the AI buildout.
As the AI capex boom continues to evolve, investors need to strike the difficult balance of participation and discipline, rather than committing to the binary choice between embracing AI and completely avoiding it. Diversification should be viewed through multiple lenses. A chipmaker, a cloud provider, and a data-center lender can respond differently to technological change while still depending on the same spending cycle. Maintaining exposure to different industries, geographies, and sources of return can reduce reliance on a single outcome.
Valuation remains the final filter. Even excellent businesses can produce disappointing returns when their prices leave little room for execution risk or changing expectations. Investors should ask which assumptions about growth, margins, adoption, and capital intensity are necessary to justify current market pricing. The AI opportunity can continue to develop while the economic backdrop becomes less forgiving, but maintaining exposure without abandoning discipline will be paramount.
Outlook
The remainder of 2026 will bring multiple challenges for markets. The Fed will meet two more times before the calendar rolls over, and current market pricing suggests at least one more hike is still to come (though expectations have moved around quite a bit in recent weeks). The Fed remains in a difficult position, as the economy is being influenced by forces that sit somewhat outside the traditional framework of monetary policy. The secular AI infrastructure buildout continues to drive substantial capital expenditures across the technology ecosystem, providing a source of economic momentum that may be relatively insensitive to modest changes in borrowing costs. Simultaneously, geopolitical instability and higher energy prices are creating inflationary pressures that cannot be easily addressed through tighter financial conditions.
November’s midterm elections also present uncertainty that markets must contend with. Republicans are clinging to a small majority in the House and Senate, but risk losing control of both. History suggests that the president’s party tends to lose ground during mid-term election cycles, and prediction markets are currently suggesting that this cycle will not differ from the norm. The good news for investors is that markets tend to perform well after the conclusion of the midterm elections, bolstered by the clarity that follows. More importantly, the factors that ultimately drive long-term market returns remain intact. The economy continues to expand, employment conditions remain healthy, and corporate earnings growth continues to exceed expectations in many sectors. While the path forward is unlikely to be free of volatility, we continue to see reasons for cautious optimism as we enter the fourth quarter.
1 Oxford Economics, “Is an AI downturn unavoidable?”, September 29, 2026.
2 International Monetary Fund, 2026 Annual Report, “AI: Deployment and Disruption.”
Disclosures & Definitions
Comparisons to any indices referenced herein are for illustrative purposes only and are not meant to imply that actual returns or volatility will be similar to the indices. Indices cannot be invested in directly. Unmanaged index returns assume reinvestment of any and all distributions and do not reflect our fees or expenses. Market returns shown in text are as of the publish date and source from Morningstar or FactSet unless otherwise listed.
- The S&P 500 is a capitalization-weighted index designed to measure performance of the broad domestic economy through changes in the aggregate market value of 500 stocks representing all major industries.
- Russell 2000 consists of the 2,000 smallest U.S. companies in the Russell 3000 index.
- MSCI EAFE is an equity index which captures large and mid-cap representation across Developed Markets countries around the world, excluding the U.S. and Canada. The index covers approximately 85% of the free float-adjusted market capitalization in each country.
- MSCI Emerging Markets captures large and mid-cap representation across Emerging Markets countries. The index covers approximately 85% of the free-float adjusted market capitalization in each country.
- Bloomberg U.S. Aggregate Index covers the U.S. investment grade fixed rate bond market, with index components for government and corporate securities, mortgage pass-through securities, and asset-backed securities.
- Bloomberg U.S. Corporate High Yield Index covers the universe of fixed rate, non-investment grade debt. Eurobonds and debt issues from countries designated as emerging markets (sovereign rating of Baa1/BBB+/BBB+ and below using the middle of Moody’s, S&P, and Fitch) are excluded, but Canadian and global bonds (SEC registered) of issuers in non-EMG countries are included.
- FTSE NAREIT Equity REITs Index contains all Equity REITs not designed as Timber REITs or Infrastructure REITs.
- Bloomberg Commodity Index is calculated on an excess return basis and reflects commodity futures price movements. The index rebalances annually weighted 2/3 by trading volume and 1/3 by world production and weight-caps are applied at the commodity, sector and group level for diversification.
Material Risks
- Fixed Income securities are subject to interest rate risks, the risk of default and liquidity risk. U.S. investors exposed to non-U.S. fixed income may also be subject to currency risk and fluctuations.
- Cash may be subject to the loss of principal and over longer periods of time may lose purchasing power due to inflation.
- Domestic Equity can be volatile. The rise or fall in prices take place for a number of reasons including, but not limited to changes to underlying company conditions, sector or industry factors, or other macro events. These may happen quickly and unpredictably.
- International Equity can be volatile. The rise or fall in prices take place for a number of reasons including, but not limited to changes to underlying company conditions, sector or industry impacts, or other macro events. These may happen quickly and unpredictably. International equity allocations may also be impacted by currency and/or country specific risks which may result in lower liquidity in some markets.
- Real Assets can be volatile and may include asset segments that may have greater volatility than investment in traditional equity securities. Such volatility could be influenced by a myriad of factors including, but not limited to overall market volatility, changes in interest rates, political and regulatory developments, or other exogenous events like weather or natural disaster.
- Private Real Estate involves higher risk and is suitable only for sophisticated investors. Real estate assets can be volatile and may include unique risks to the asset class like leverage and/or industry, sector or geographical concentration. Declines in real estate value may take place for a number of reasons including, but are not limited to economic conditions, change in condition of the underlying property or defaults by the borrower.
- All investing involves risk including the potential loss of principal. Market volatility may significantly impact the value of your investments. Recent tariff announcements may add to this volatility, creating additional economic uncertainty and potentially affecting the value of certain investments. Tariffs can impact various sectors differently, leading to changes in market dynamics and investment performance. You should consider these factors when making investment decisions. We recommend consulting with a qualified financial adviser to understand how these risks may affect your portfolio and to develop a strategy that aligns with your financial goals and risk tolerance